Analytics
Overview
Section titled “Overview”The Analytics section of Transpeye provides purpose-built views for understanding patterns across your alert and transaction data. Rather than examining individual records, analytics views aggregate data to reveal trends, outliers, geographic concentrations, and comparative performance across your estate. Each view is accessed from the Analytics dropdown in the navigation bar.
Step-by-Step Guide
Section titled “Step-by-Step Guide”Step 1: Open Hero Alerts
Section titled “Step 1: Open Hero Alerts”In the navigation bar, click Analytics, then click Hero Alerts. Hero Alerts at /hero_alerts shows curated, normalised risk signals for stores and operators. Use this view when you want to find abnormal behaviour quickly rather than scan raw totals.
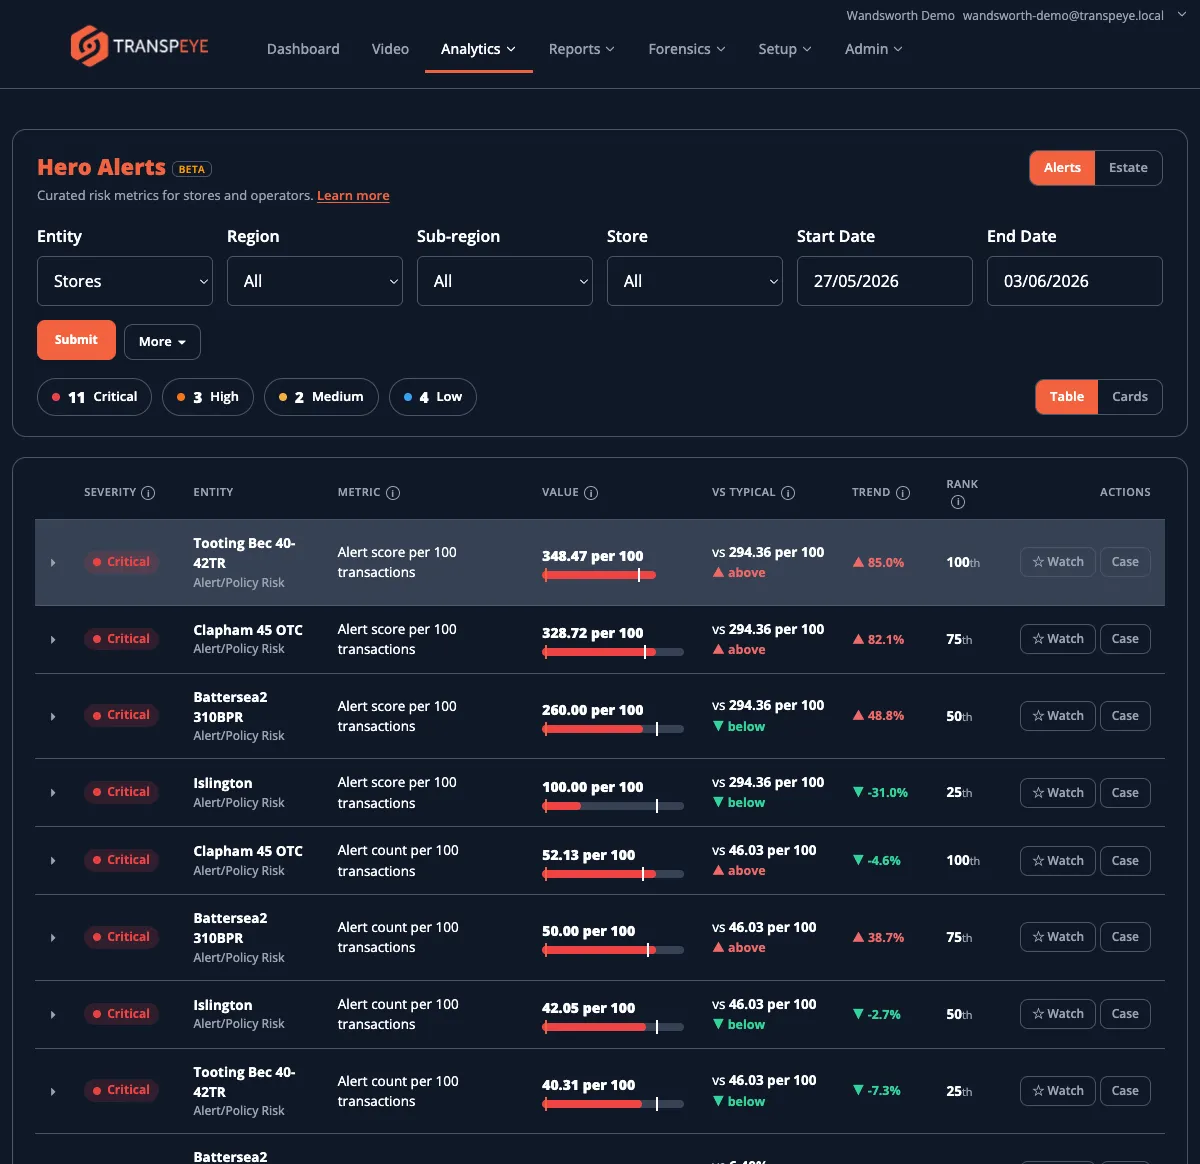
Hero Alerts includes table and card views, an estate overview, watchlist actions, and case handoff. See Hero Alerts for the full workflow.
Step 2: Open the Drilldown View
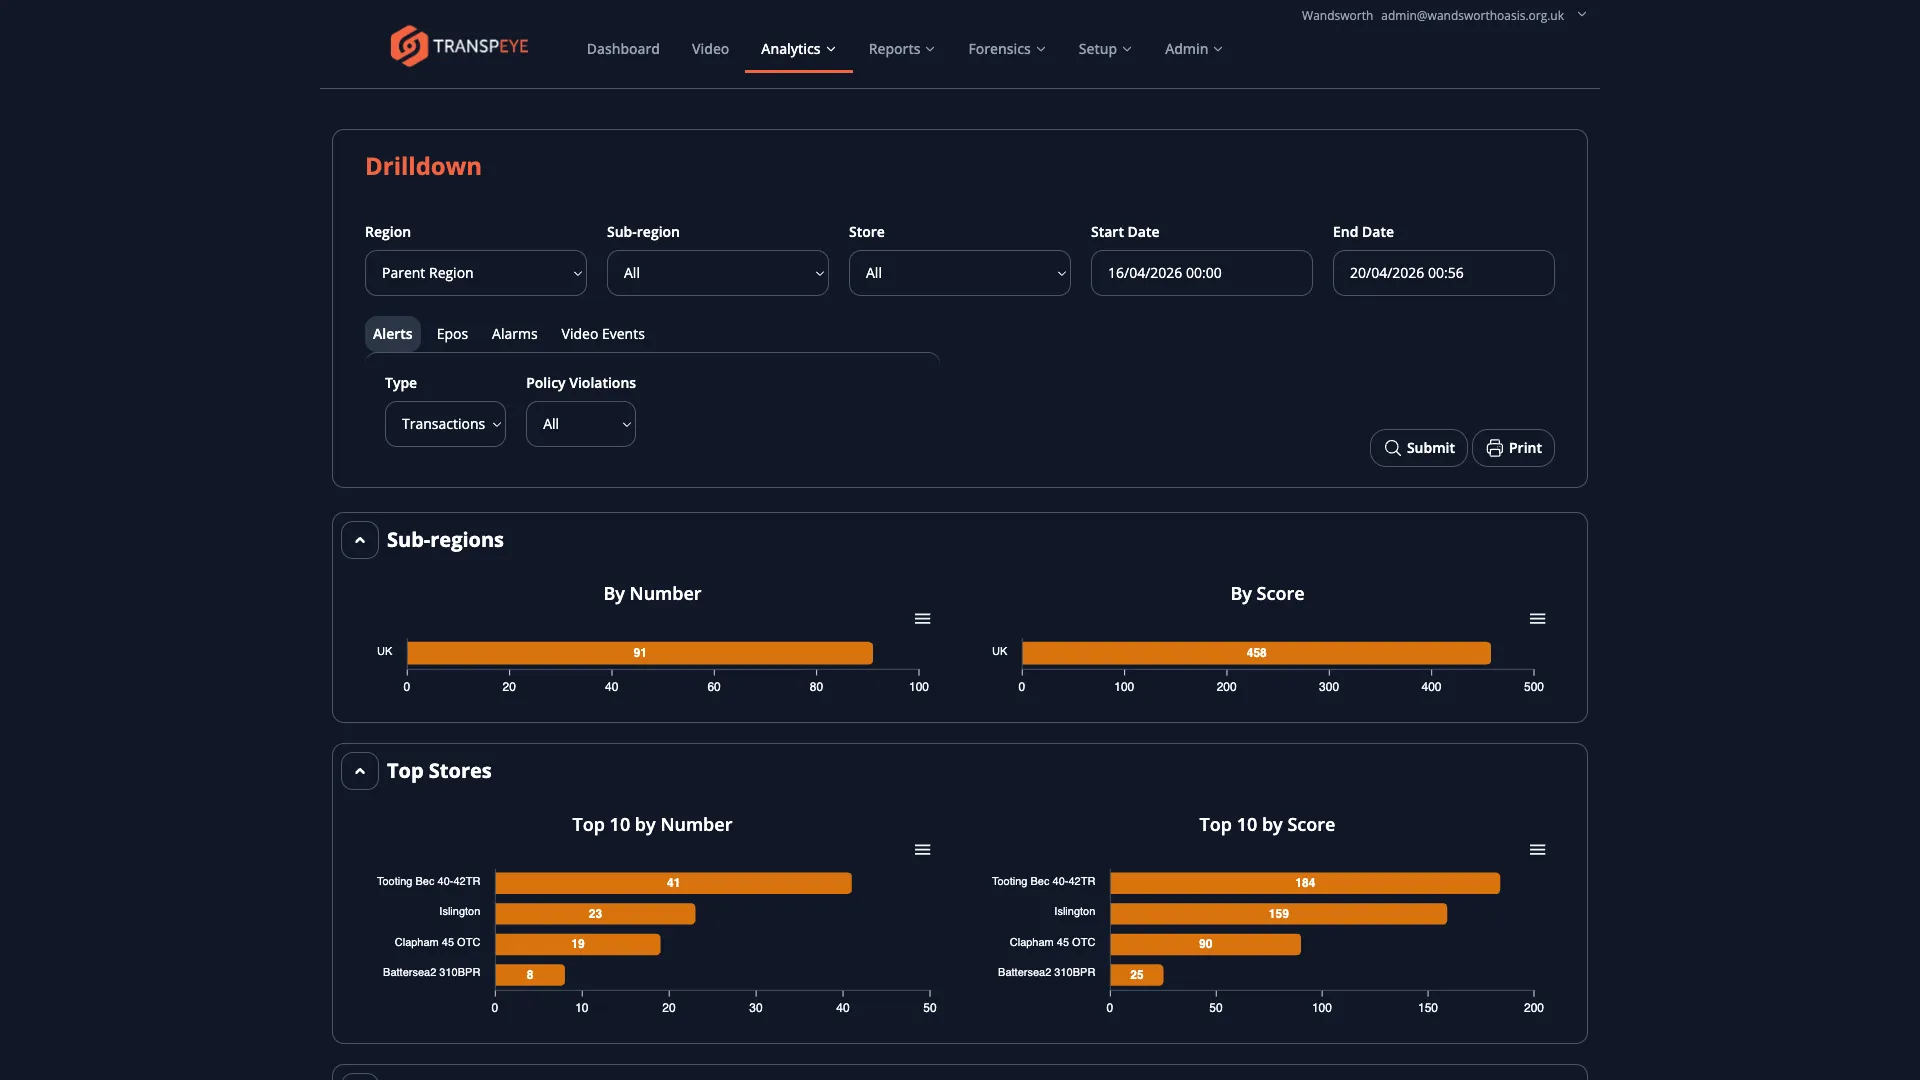
Section titled “Step 2: Open the Drilldown View”In the navigation bar, click Analytics, then click Drilldown. The Drilldown view at /drilldown presents a hierarchical breakdown of alert or transaction activity, starting at the level of your entire estate and allowing you to drill into individual regions, sub-regions, and stores.
How to Use the Drilldown View
Section titled “How to Use the Drilldown View”The Drilldown view contains a filter panel on the left side and a chart area on the right.
Filters available in Drilldown:
| Filter | Purpose |
|---|---|
| Start Date / End Date | Set the analysis period |
| Type | Switch between Alerts, Alarms, or Video Events as the data source |
| Region | Select a region to see a breakdown of its sub-regions |
| Sub-region | Select a sub-region to see a breakdown of its stores |
| Store | Select a specific store to see its detail |
Navigate through the hierarchy by selecting more specific values in the filter dropdowns. The chart updates to reflect your selection, showing progressively more granular breakdowns as you drill down from estate level to region, sub-region, and store.
You can also navigate using the chart itself — clicking a bar in the chart selects that entity and automatically updates the filters to drill down one level.
When a date range is selected, Drilldown may show a Compared with previous period line above the chart and comparison labels on the bars or tooltips. These labels compare each region, store, or sub-section with the immediately preceding period of the same length, helping you see whether activity is new, unchanged, rising, or falling.
Step 3: Open the Timeseries View
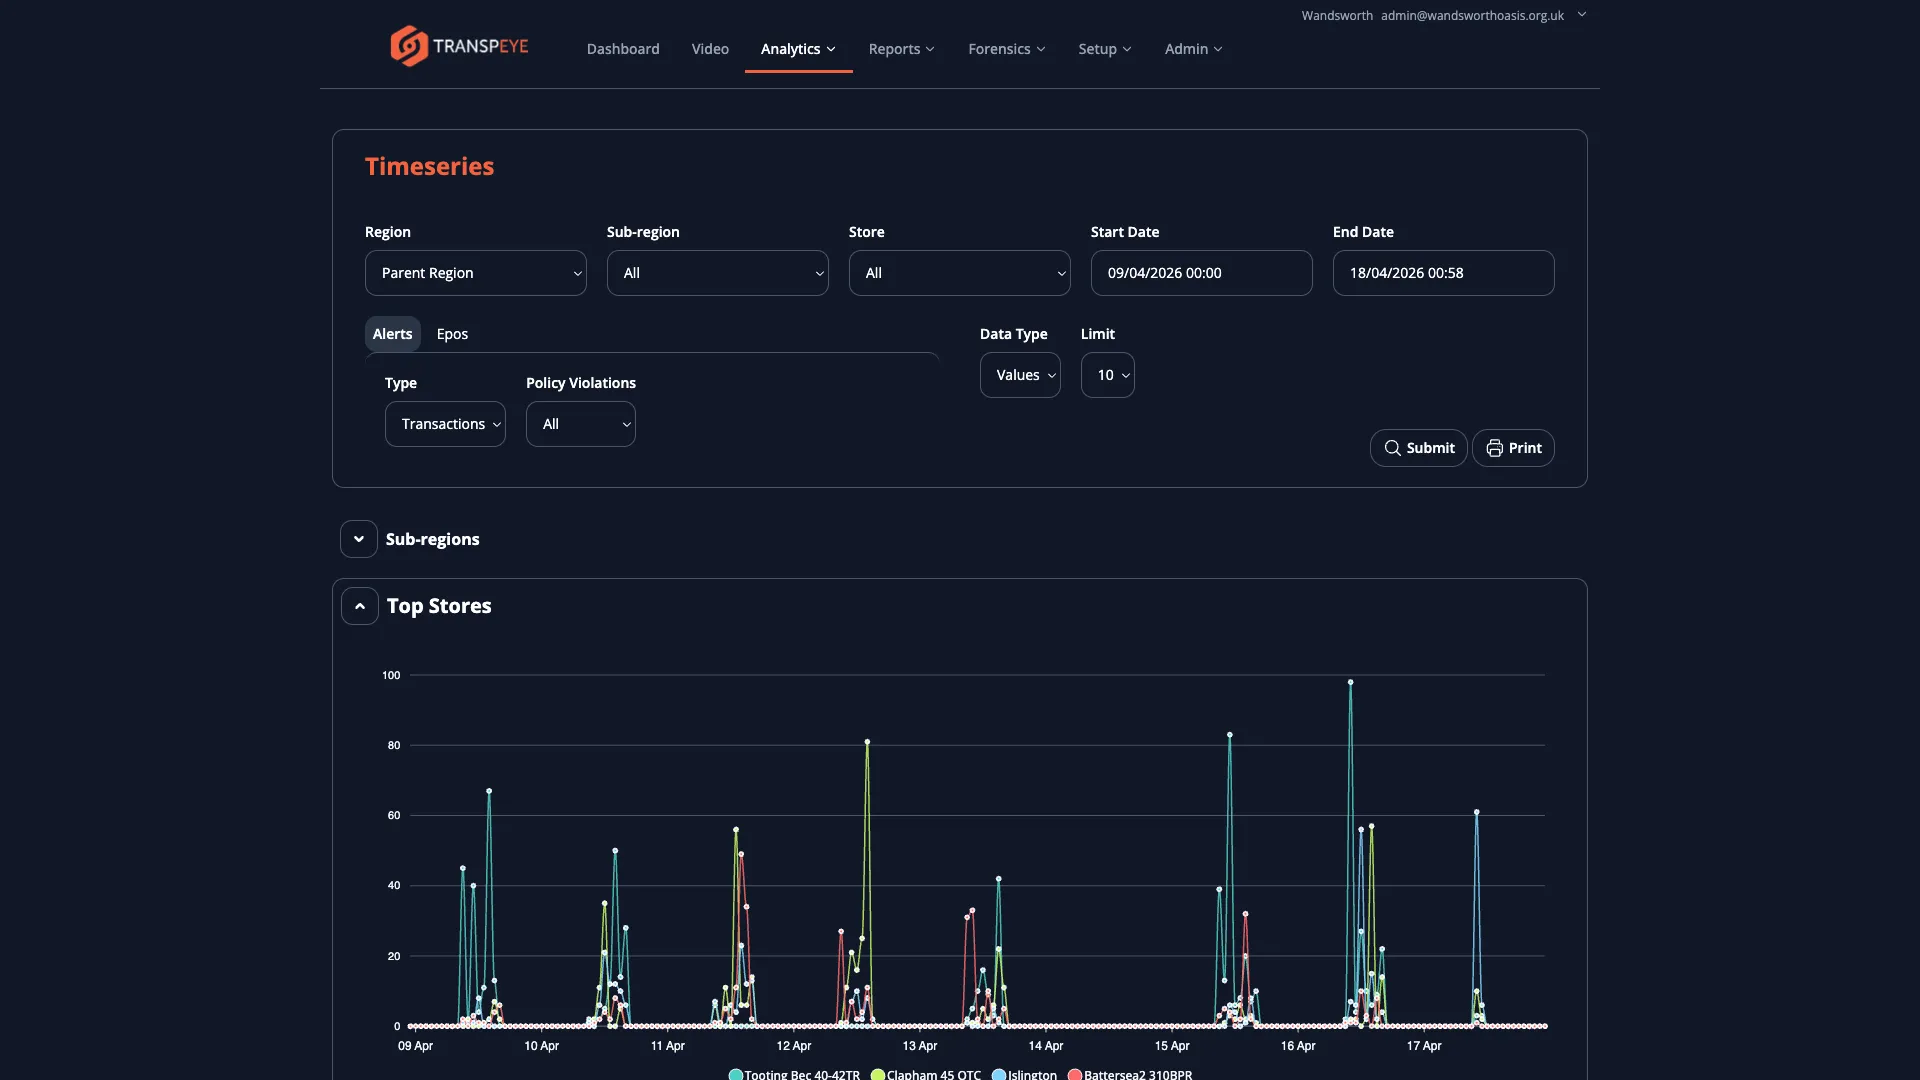
Section titled “Step 3: Open the Timeseries View”In the navigation bar, click Analytics, then click Timeseries. The Timeseries view at /timeseries plots your alert or transaction data as a time series, showing how activity has changed over time.
How to Use the Timeseries View
Section titled “How to Use the Timeseries View”Use the filter panel to select your date range, data type (alerts, transactions, or events), and optional region and store filters. The chart draws one or more lines representing the selected metric over time. This view is most useful for:
- Identifying increases or decreases in alert frequency over weeks or months
- Spotting seasonal or weekly patterns in exception activity
- Comparing activity before and after an operational change (for example, a new policy deployment or a staff scheduling change)
Hover over any point on the chart to view the exact value for that time interval.
Step 4: Open the Quadrant View
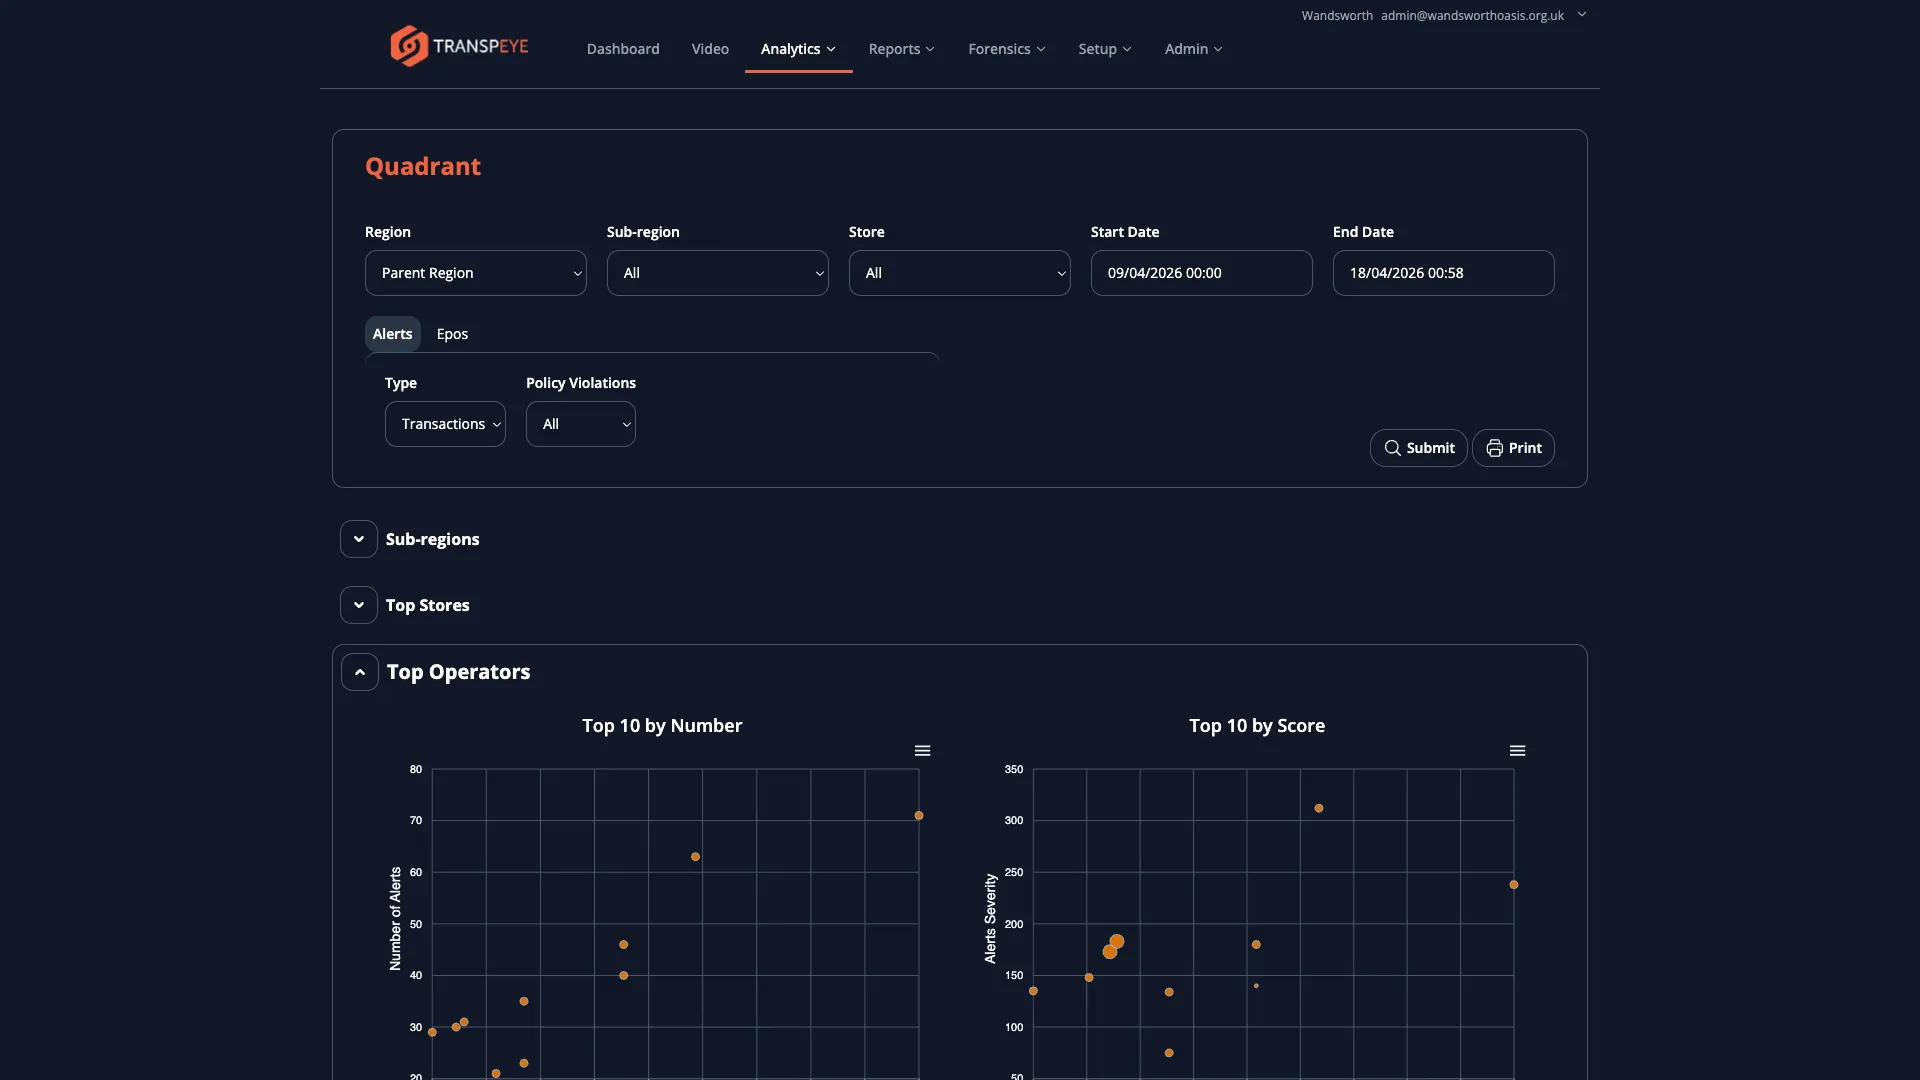
Section titled “Step 4: Open the Quadrant View”In the navigation bar, click Analytics, then click Quadrant. The Quadrant view at /quadrant plots each store (or region) on a two-dimensional scatter chart with transaction volume on one axis and exception rate on the other.
How to Use the Quadrant View
Section titled “How to Use the Quadrant View”The quadrant chart divides your estate into four zones:
| Quadrant | Volume | Exception Rate | Interpretation |
|---|---|---|---|
| Top Right | High | High | High-traffic, high-risk stores — priority for investigation |
| Top Left | Low | High | Low-traffic stores with disproportionate exception activity — warrants attention |
| Bottom Right | High | Low | High-traffic, well-controlled stores — benchmark examples |
| Bottom Left | Low | Low | Low-traffic, low-risk stores — lower priority |
Use the filter panel to switch between viewing by store, sub-region, or region, and to change the date range. Hover over any data point to see the store name and its exact values. Click a data point to navigate to the Drilldown view for that location.
Step 5: Open the Hotspot View
Section titled “Step 5: Open the Hotspot View”In the navigation bar, click Analytics, then click Hotspot. The Hotspot view at /hotspot displays a geographic representation of exception activity across your estate, allowing you to quickly identify which locations have the highest concentration of alerts.
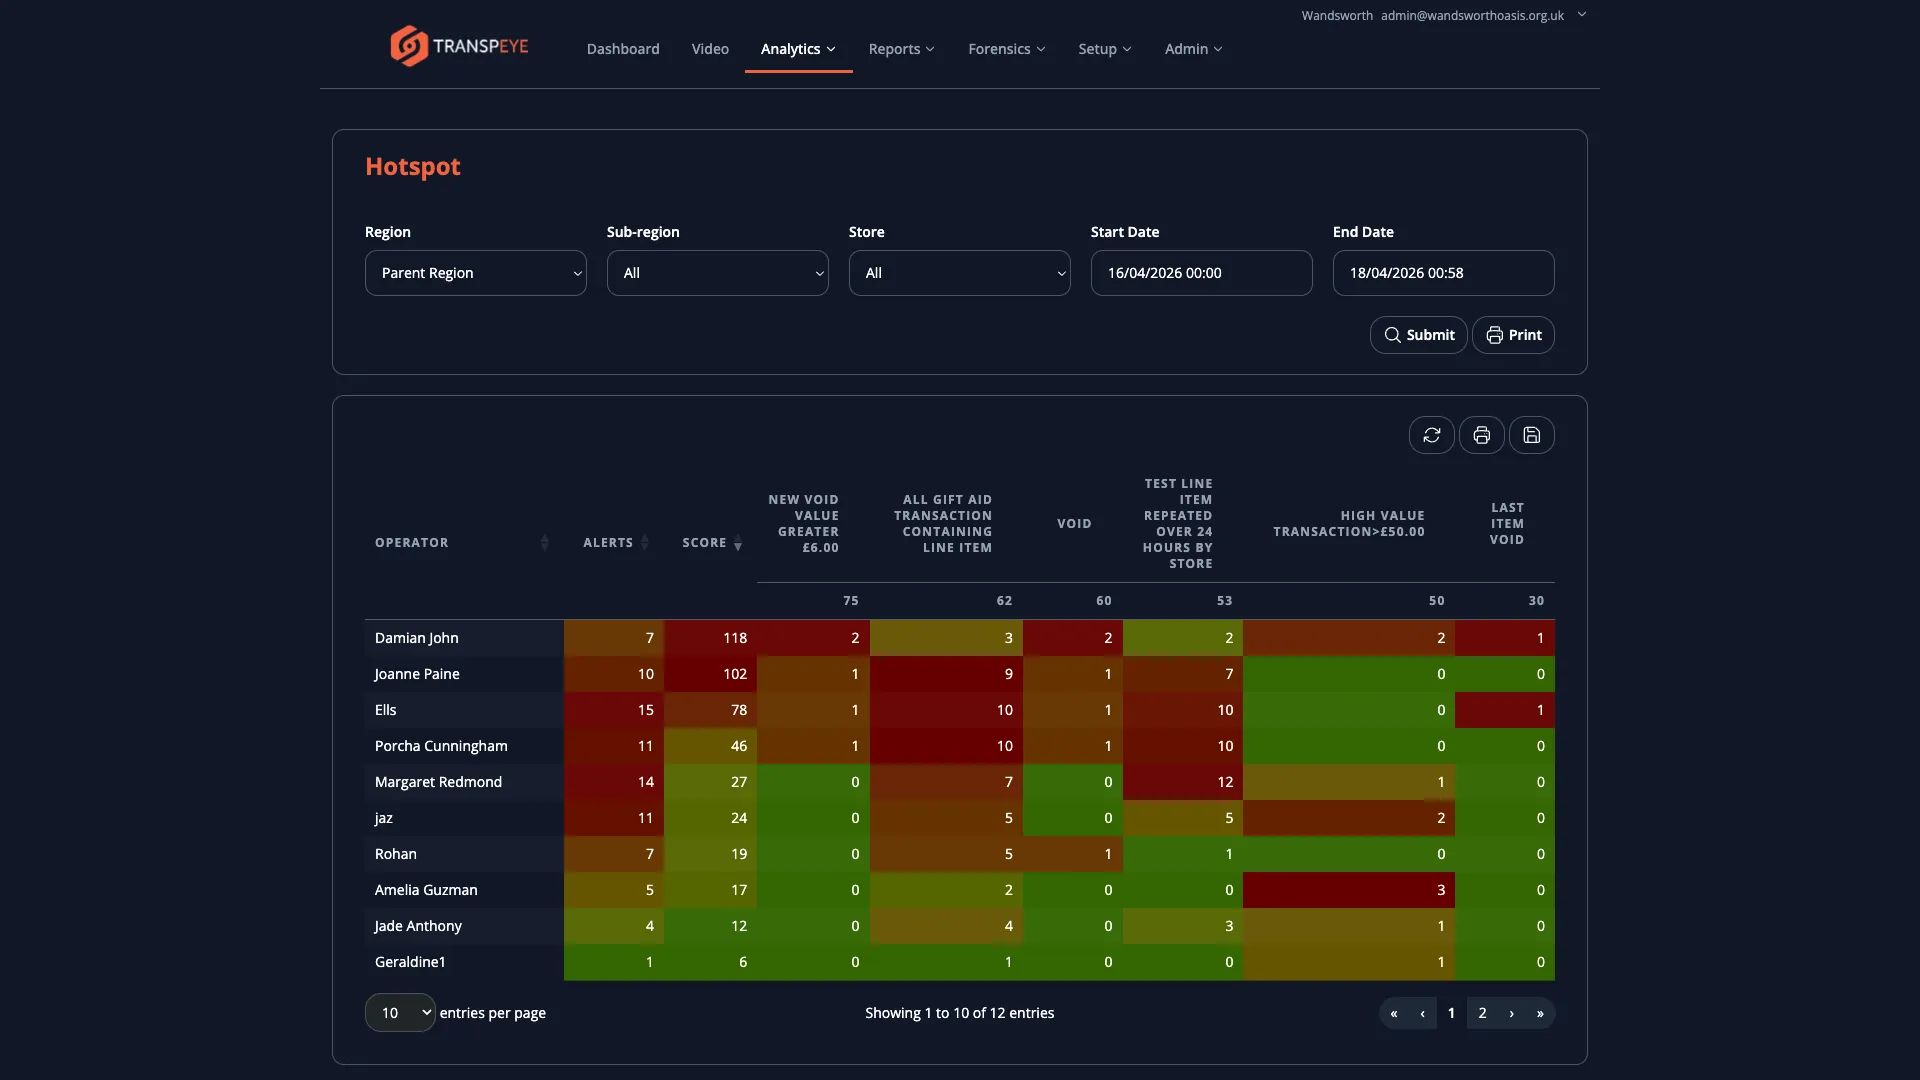
How to Use the Hotspot View
Section titled “How to Use the Hotspot View”The Hotspot view presents locations colour-coded or ranked by alert intensity. Locations with more alerts or higher alert scores appear more prominently. Use the date and data type filters to focus the analysis.
This view is well suited to:
- Morning briefings where you need to identify which sites need immediate attention
- Multi-site estate reviews to prioritise field investigations
- Presenting exception activity to management in a visual format
- Use Hero Alerts to start with abnormal risk. Hero Alerts highlight stores and operators that are unusual compared with peers or the previous period.
- Use Drilldown to prepare for investigations. Before opening the Transactions or Alerts pages, use the Drilldown view to identify which store or operator area you should focus on. This saves time by narrowing your scope.
- Use Timeseries to validate policy changes. After enabling or adjusting a policy, check the Timeseries view over the following days to confirm whether alert volumes have changed as expected.
- Use Quadrant to prioritise store visits. If your organisation conducts periodic in-store investigations, the Top Right quadrant (high volume, high exceptions) indicates which stores to visit first.
- Filter consistently across all views. The date range and data type filters work similarly across all four analytics views. Apply the same period in each view to ensure your comparisons are consistent.
- Drilldown supports multiple alert types. Switch the Type filter between Transactions, Alarms, and Video Events to examine exception activity from different data sources within the same hierarchical view.
Troubleshooting
Section titled “Troubleshooting”| Problem | Solution |
|---|---|
| Hero Alerts is not visible | The feature may not be enabled for your account, or your role may not include Analytics access. |
| The Drilldown chart shows no bars | There may be no data for the selected type and date range. Try switching the Type filter or widening the date range. |
| The Quadrant chart is empty | Ensure your stores have transaction and alert data for the selected period. New accounts or recently connected sites may have insufficient data to populate the chart. |
| The Timeseries line is flat or shows zeros | Check that your policies are enabled and that agents are connected and sending data. A flat line on a live account may indicate a data ingestion issue. Contact your administrator. |
| The Hotspot view does not highlight any locations | If all stores have similar alert counts, the relative colouring may be subtle. Check the underlying alert data in the Alerts or Drilldown view. |
| Clicking a chart point does not navigate to Drilldown | Ensure your browser session is still active. If the login page appears, sign in again. |