Dashboard Overview
Overview
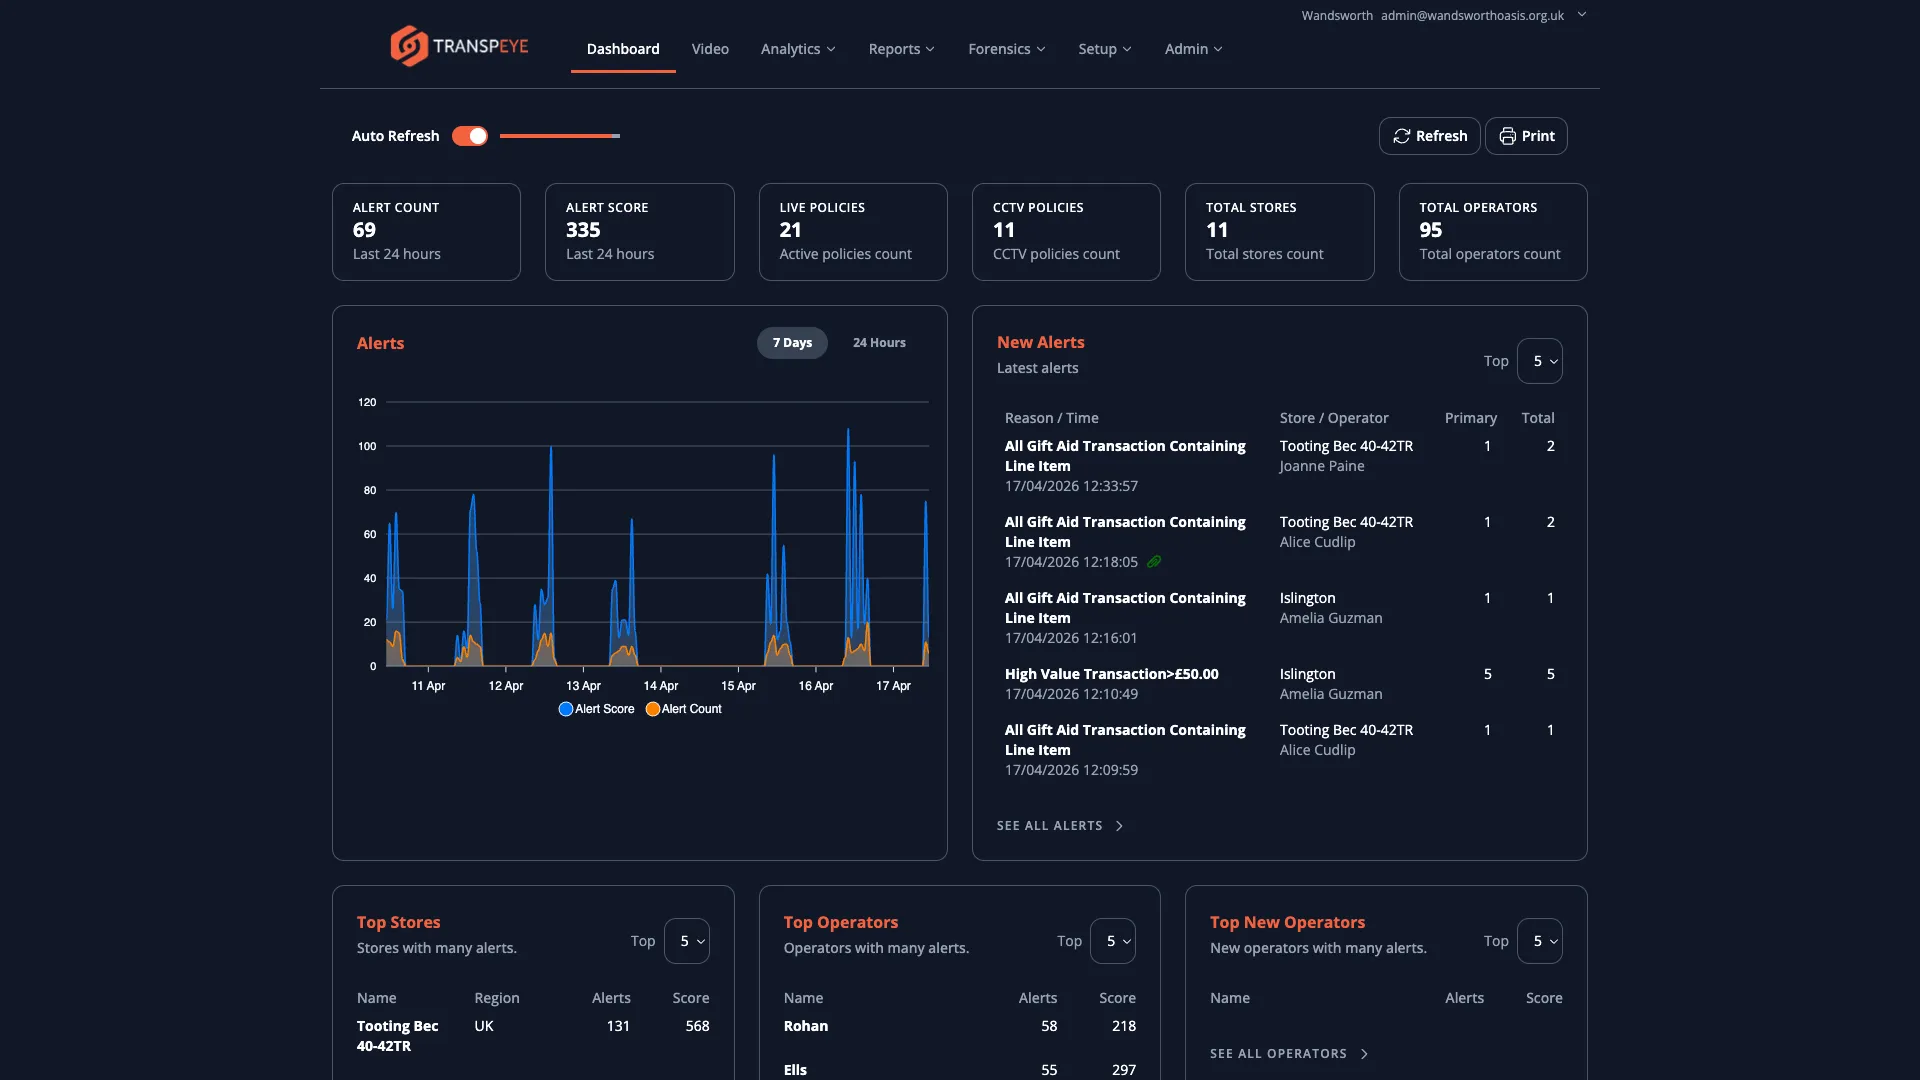
Section titled “Overview”The Dashboard is the first page you see after logging in to Transpeye. It provides an at-a-glance summary of your surveillance and transaction activity, including key performance metrics, a time-series alerts chart, a list of the most recent new alerts, and rankings of your top stores and operators by alert count. The dashboard updates automatically and can be refreshed manually at any time.
Step-by-Step Guide
Section titled “Step-by-Step Guide”Step 1: Locate the Summary Metric Cards
Section titled “Step 1: Locate the Summary Metric Cards”At the top of the dashboard you will find a row of up to six summary cards. Each card displays a single key figure for your account. The cards typically include:
| Card | What it shows |
|---|---|
| Alert Count | Total number of alerts raised in the current period |
| Alert Score | Cumulative risk score across all alerts |
| Live Policies | Number of transaction or EPOS policies currently enabled |
| CCTV Policies | Number of camera-based event policies currently enabled |
| Total Stores | Number of stores configured in your account |
| Total Operators | Number of operators (till staff) registered in your account |
These cards give you an immediate sense of system activity without needing to open any other section.
Step 2: Review the Alerts Chart
Section titled “Step 2: Review the Alerts Chart”Below the summary cards, on the left side of the page, is the Alerts time-series chart. This chart plots two data series over time:
- Alert Score — the cumulative risk score, shown in blue
- Alert Count — the total number of alerts, shown in orange
You can switch the time window using the buttons in the chart header:
- “7 Days” — shows the previous seven days of activity (the default view)
- “24 Hours” — narrows the view to the last twenty-four hours for a more detailed intraday picture
Hover over any point on the chart to see a tooltip showing the exact Alert Score and Alert Count for that time interval.
Step 3: Review the New Alerts Panel
Section titled “Step 3: Review the New Alerts Panel”To the right of the Alerts chart is the New Alerts panel. This panel lists the most recently triggered alerts for your account. For each alert, you can see:
- Reason / Time — the policy that triggered the alert and the time it occurred
- Store / Operator — the location and staff member involved
- Primary — the primary financial value associated with the alert (for example, the transaction value)
- Total — the total financial value across related transactions
Use the Top dropdown in the panel header to control how many recent alerts are shown. Available options are 1, 5, 25, 50, and 100.
Click any alert row to open the alert detail view, where you can see full transaction information, attachments, and audit history.
Step 4: Review the Top Stores Panel
Section titled “Step 4: Review the Top Stores Panel”Below the chart and alerts panel, you will find the Top Stores section. This ranks your stores by the number of alerts they have generated in the rolling seven-day window. For each store, the panel shows:
- The store name and parent region
- The total alert count for the period
- The aggregate alert score
Use the store count selector to adjust how many stores are displayed.
Step 5: Review the Top Operators Panel
Section titled “Step 5: Review the Top Operators Panel”Alongside the Top Stores panel is the Top Operators section. This ranks individual operators (till staff) by the number of alerts associated with their transactions. The list combines current top operators with operators who are newly registered, so you can quickly identify both established patterns and emerging concerns.
Step 6: Use the Hero Alerts Widgets
Section titled “Step 6: Use the Hero Alerts Widgets”If Hero Alerts are enabled for your account, the dashboard includes Hero Alerts: Stores and Hero Alerts: Operators widgets below the standard activity panels. These widgets show the highest-risk normalised signals for the current period, including severity, metric name, current value, and comparison markers.
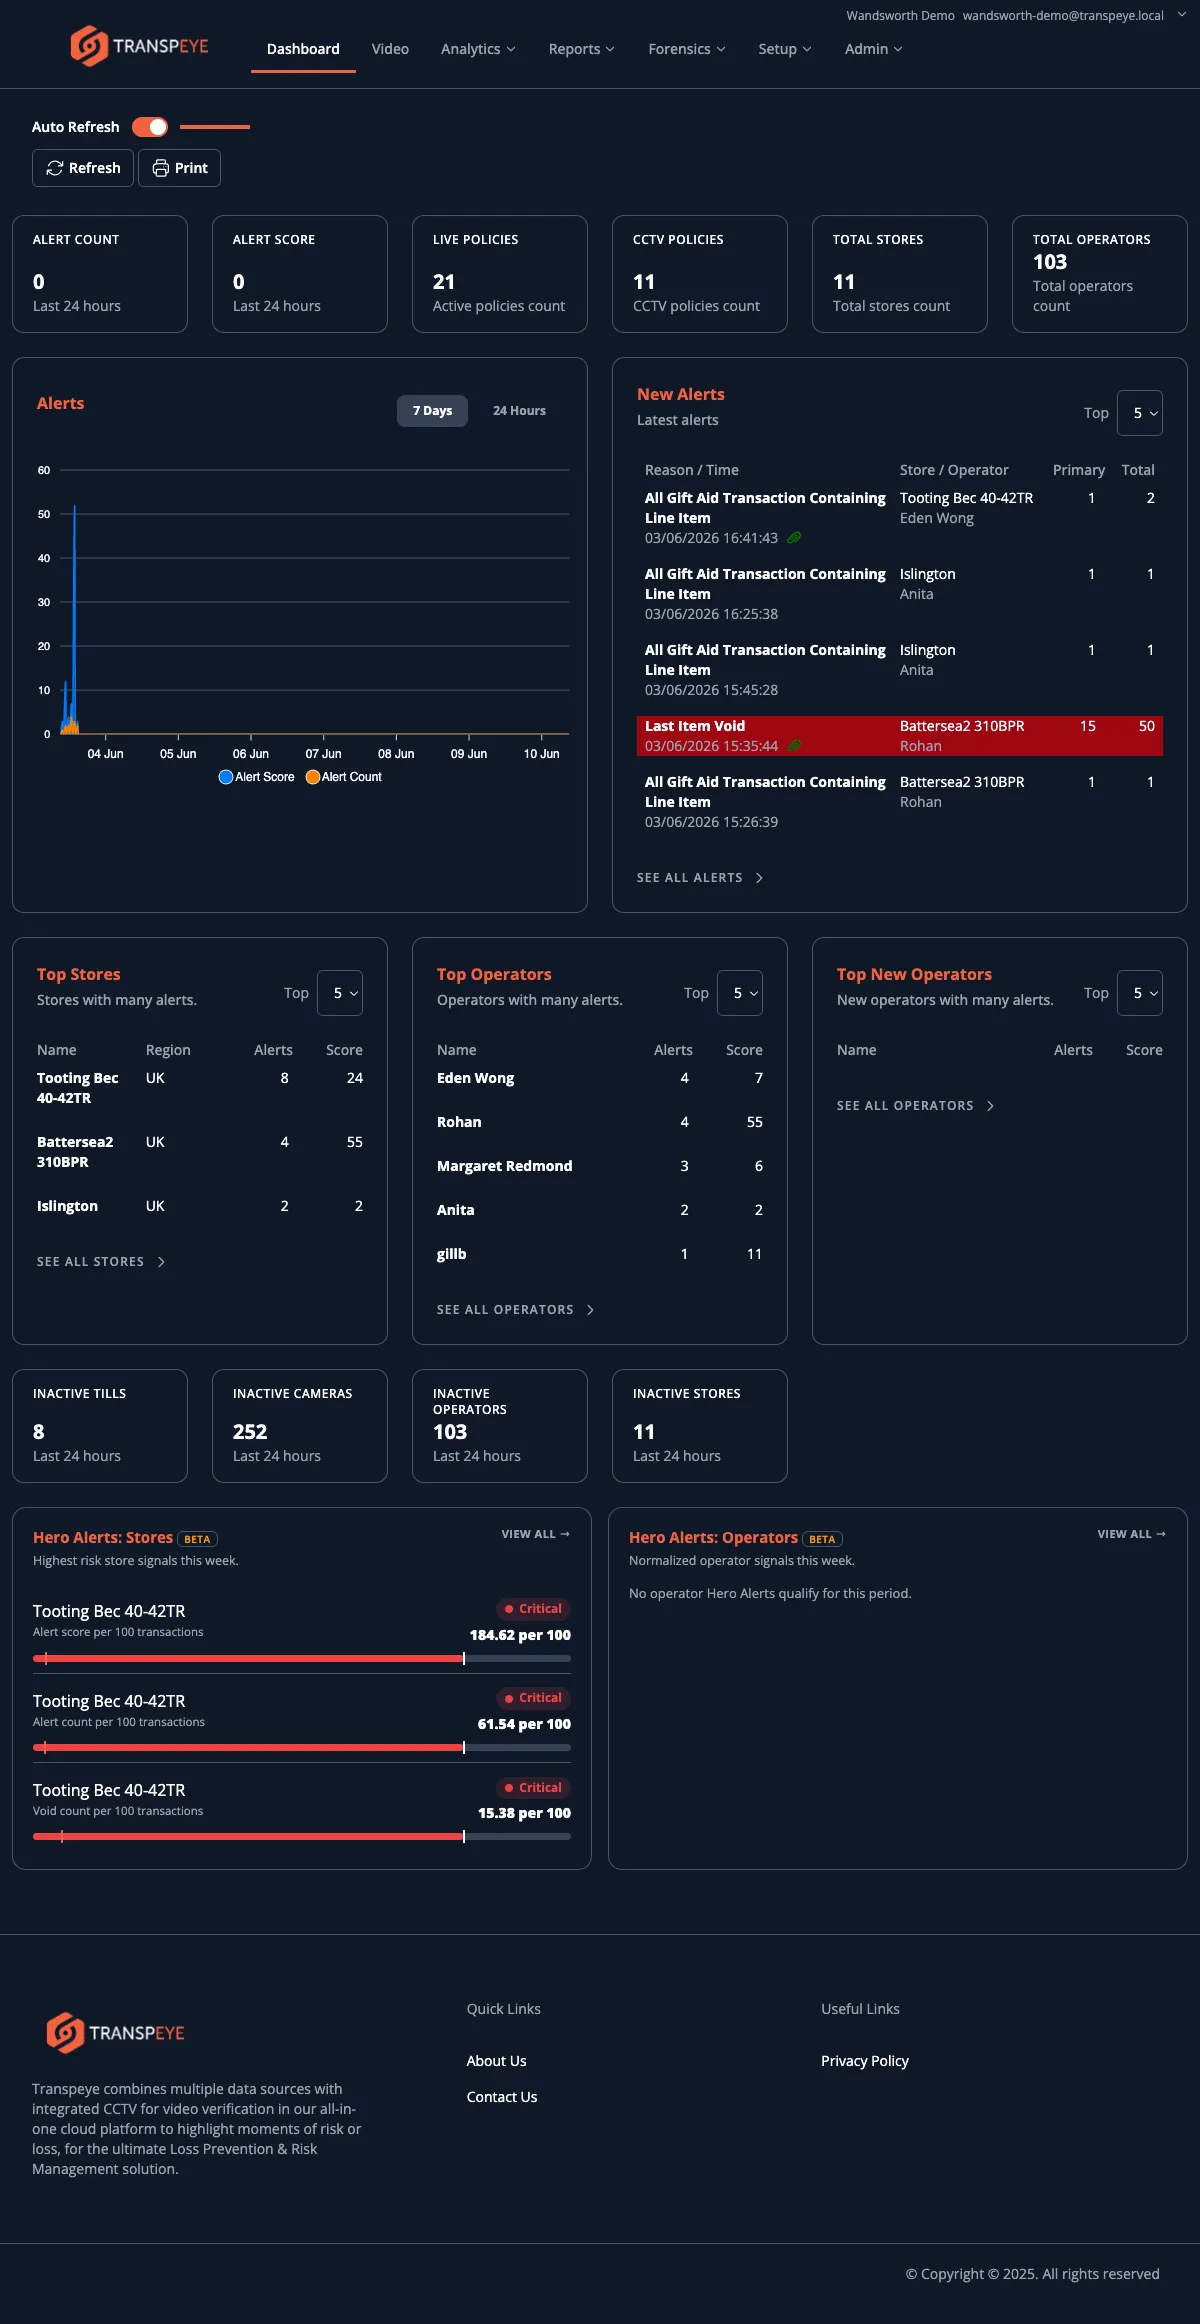
Click “View all” in a Hero Alerts widget to open the full Hero Alerts page. See Hero Alerts for the full workflow.
Step 7: Use the Auto Refresh Toggle
Section titled “Step 7: Use the Auto Refresh Toggle”In the top-left area of the dashboard, the Auto Refresh toggle switch automatically reloads the page every sixty seconds. When enabled, a thin progress bar beneath the toggle fills from left to right, indicating when the next automatic reload will occur.
- To enable auto refresh, click the Auto Refresh toggle so it turns on.
- To disable it, click the toggle again.
You can also reload the page manually at any time by clicking “Refresh” in the top-right area of the dashboard. Click “Print” to send the current dashboard view to your printer.
- Start your day here. The dashboard is designed for a morning briefing view — check the metric cards and new alerts panel first to understand the overnight activity before drilling into detail.
- Use the 7 Days view by default. The seven-day chart window gives you enough context to spot trends. Switch to 24 Hours when you need to investigate a specific day’s pattern.
- Watch the Alert Score, not just the count. A single high-score alert may be more significant than many low-score alerts. The score reflects the severity weighting set in your policies.
- Use Hero Alerts for abnormal patterns. Dashboard totals show what happened; Hero Alerts help identify which stores or operators are unusual compared with peers and the previous period.
- Auto Refresh is useful for operations centres. If Transpeye is displayed on a monitor screen in a control room or back office, enabling Auto Refresh keeps the display current without manual intervention.
Troubleshooting
Section titled “Troubleshooting”| Problem | Solution |
|---|---|
| Summary cards are not visible | Your account may not yet have data, or your user role may restrict which metrics are shown. Contact your administrator. |
| Alerts chart shows no data | There may be no alerts in the selected time window, or data may not yet have been ingested. Confirm that your agents and policies are correctly configured. |
| New Alerts panel is empty | No alerts have been triggered in the recent period. This may be expected if activity has been low. |
| Auto Refresh does not reload the page | Check that your browser session has not expired. If the login page appears, sign in again. |
| Dashboard loads slowly | Large alert volumes can slow the initial load. Try reducing the Top count for alerts, stores, and operators to improve performance. |