Hero Alerts
Overview
Section titled “Overview”Hero Alerts are curated risk metrics that help you find the stores and operators most worth a closer look. Instead of ranking only by raw totals, Hero Alerts normalise activity by measures such as transactions, sales value, peer baseline, and previous-period movement. This makes smaller but unusual patterns easier to spot and helps high-volume stores avoid dominating every investigation list.
Hero Alerts appear on the dashboard, in the dedicated Analytics > Hero Alerts page, in store and operator scorecards, in Hero reports, and in case handoff actions. The feature is marked Beta, so available controls may depend on your account configuration.
Step-by-Step Guide
Section titled “Step-by-Step Guide”Step 1: Review Hero Alerts on the Dashboard
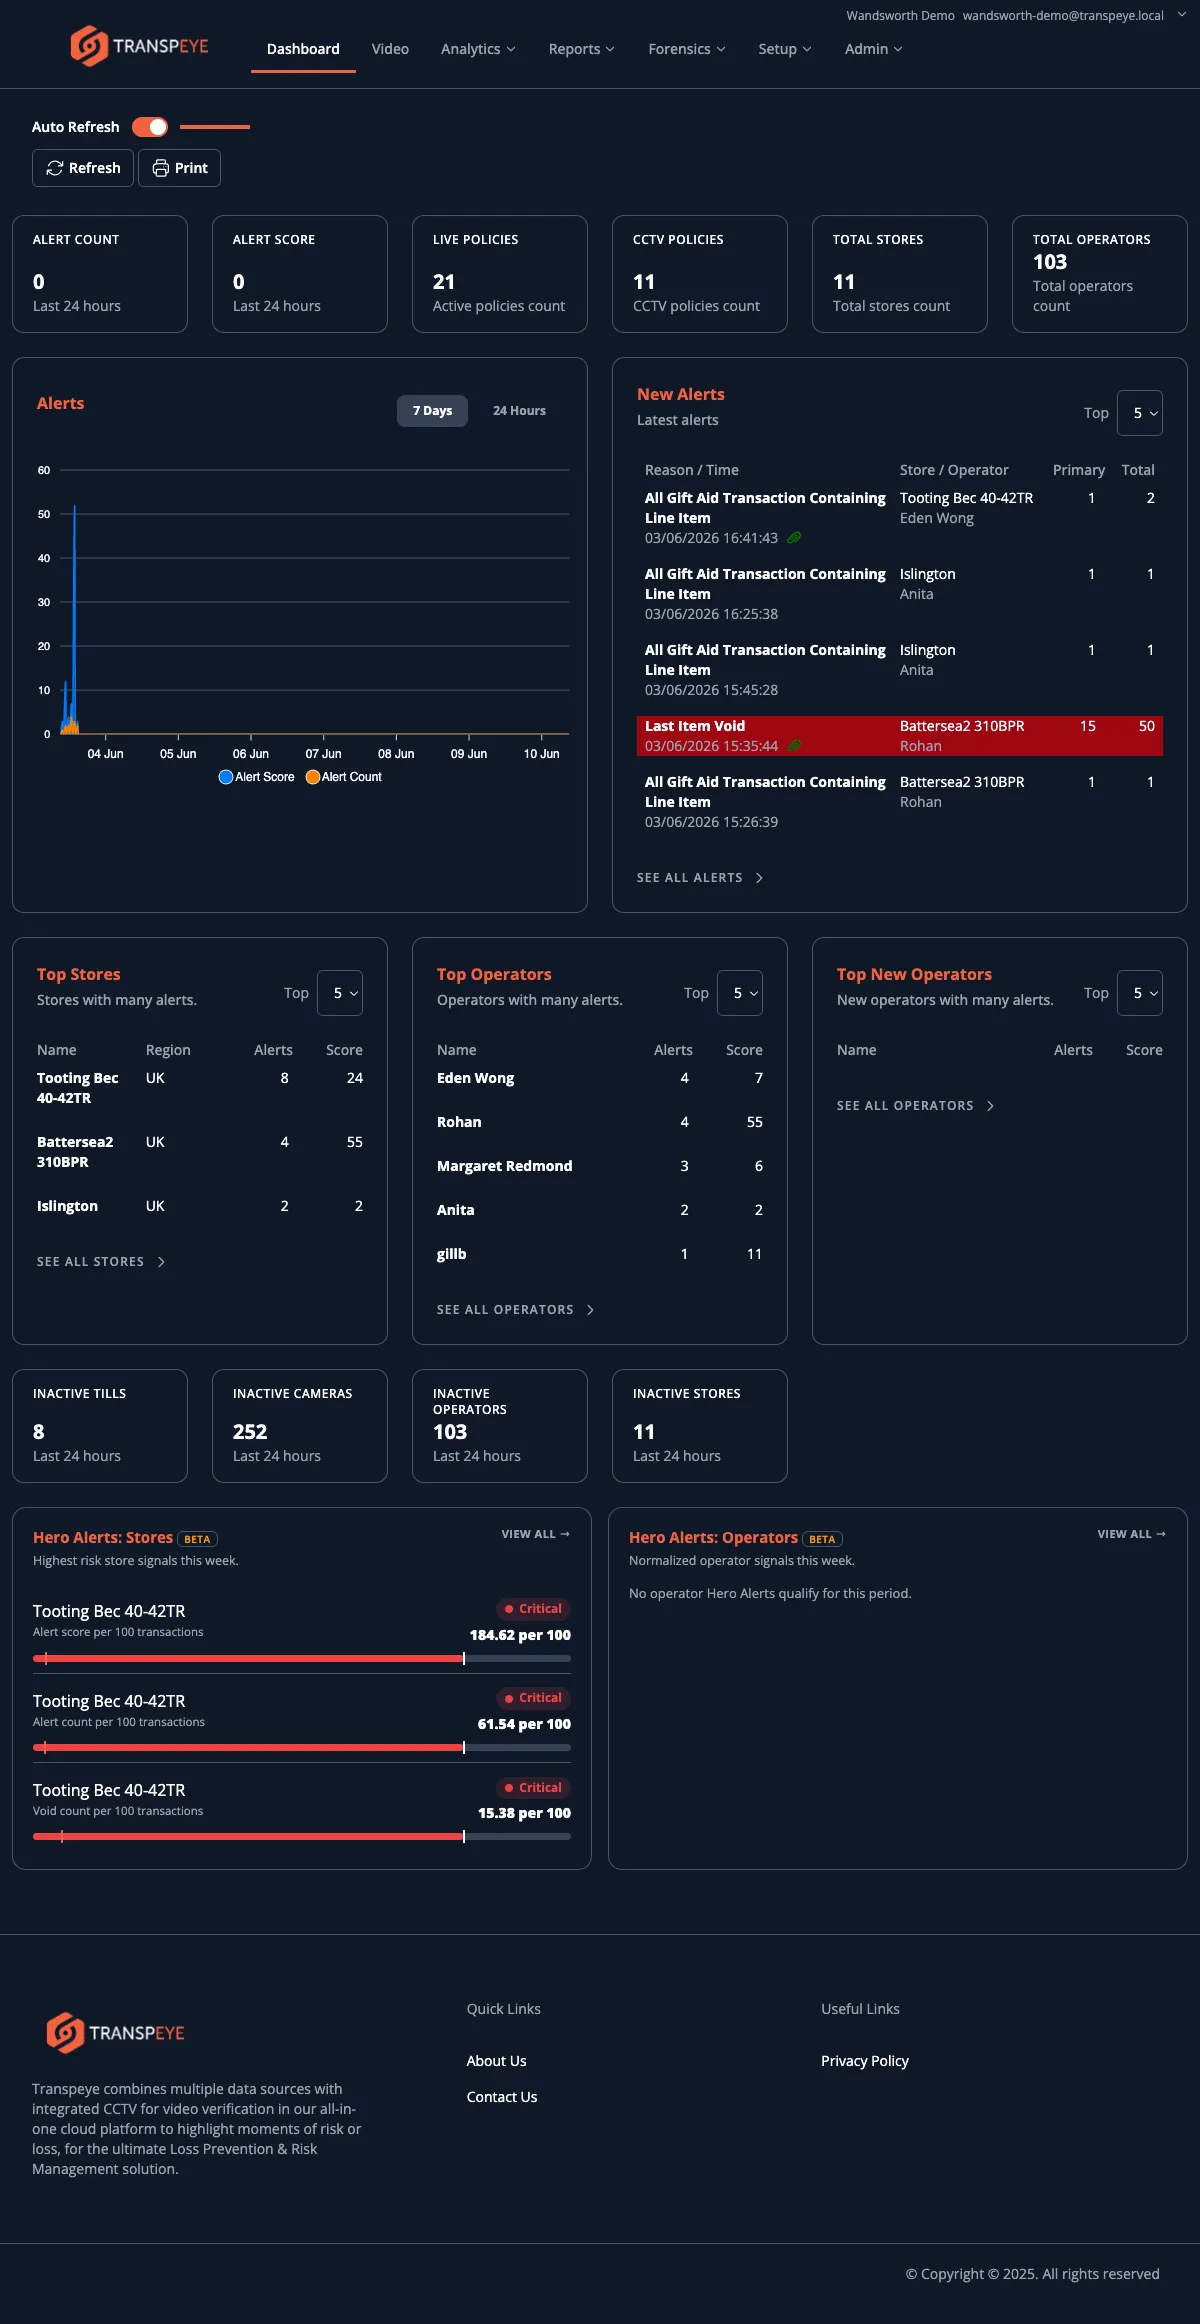
Section titled “Step 1: Review Hero Alerts on the Dashboard”Open the Dashboard. If Hero Alerts are enabled for your account, the lower dashboard area includes Hero Alerts: Stores and Hero Alerts: Operators widgets.
Each widget shows the highest-risk signals for the selected period, including the entity name, metric, severity, and a bullet-style bar showing the current value against the expected or threshold value. Click “View all” to open the full Hero Alerts page.
Step 2: Open the Hero Alerts Page
Section titled “Step 2: Open the Hero Alerts Page”In the navigation bar, click Analytics, then click Hero Alerts. The Hero Alerts page at /hero_alerts opens with filters and severity summary chips at the top.
Use the filters to choose:
| Filter | Purpose |
|---|---|
| Entity | Switch between Stores and Operators. |
| Region | Limit results to a region. |
| Sub-region | Limit results to a sub-region. |
| Store | Limit results to one store. |
| Start Date / End Date | Set the analysis period. |
| More | Open additional filter controls where available. |
Severity chips show how many matching Hero Alerts are Critical, High, Medium, and Low. Use them to understand the overall risk mix before reviewing individual rows.
Step 3: Use the Table View
Section titled “Step 3: Use the Table View”The table view is the default investigation view. It is designed for scanning, sorting, and choosing the next action.
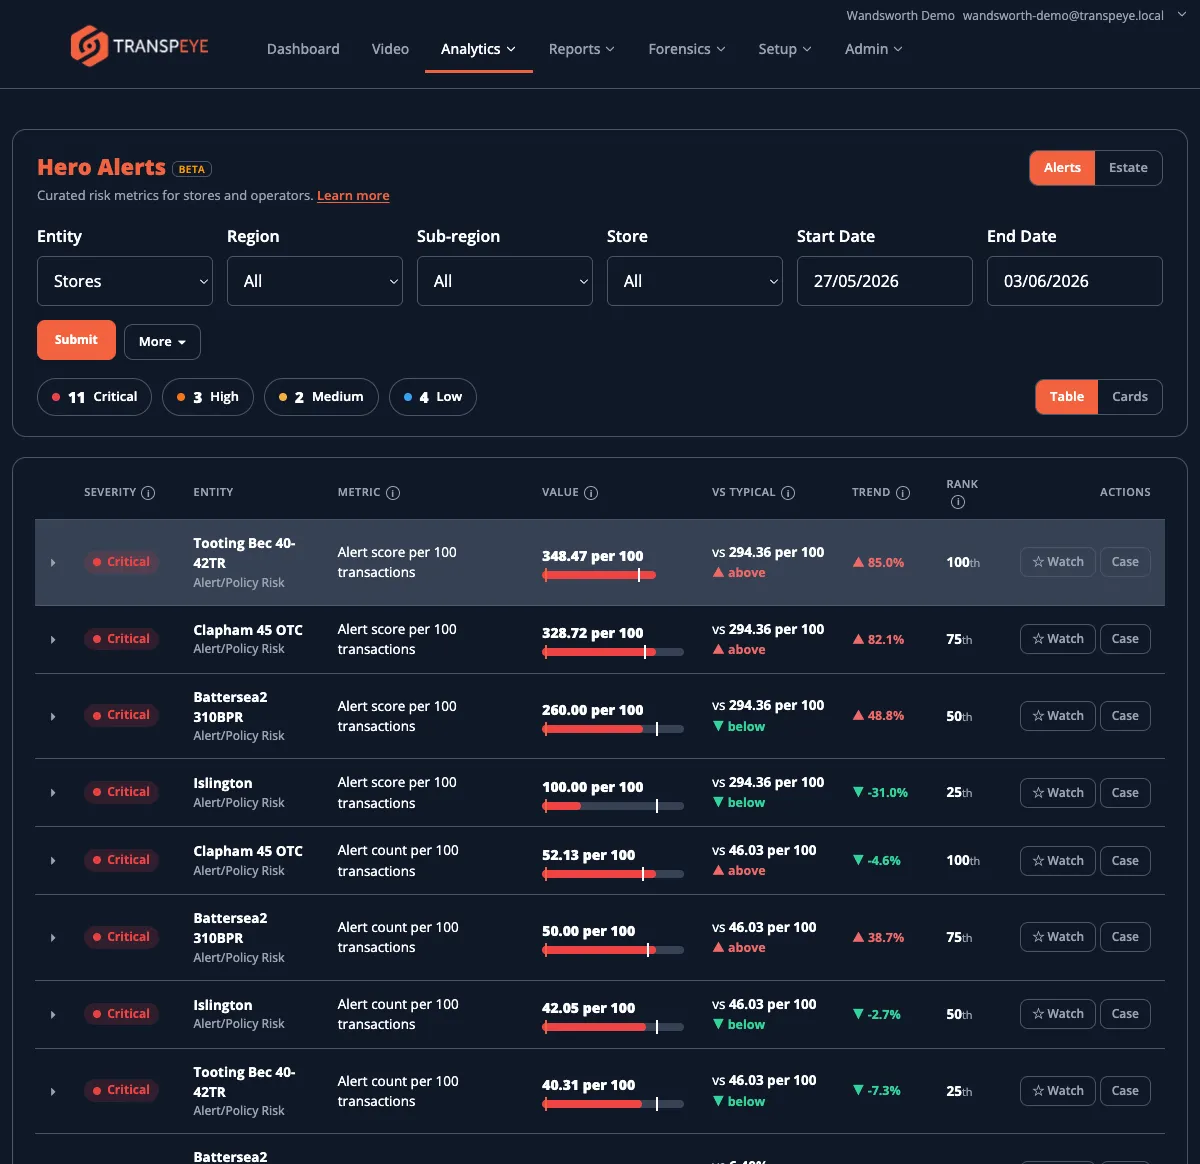
Each row shows:
| Column | What it means |
|---|---|
| Severity | The risk band assigned to the metric. |
| Entity | The store or operator being assessed. |
| Metric | The risk measure, such as alert score per 100 transactions or void value as a percentage of sales. |
| Value | The current normalised value for the selected period. |
| Vs Typical | How the value compares with the peer or typical baseline. |
| Trend | Movement compared with the previous comparable period. |
| Rank | Where the entity sits against its peer group. |
| Actions | Follow-up actions such as adding to the watchlist or opening a case. |
Click the small expander at the start of a row to reveal more explanation about why the metric was flagged.
Step 4: Use the Cards View
Section titled “Step 4: Use the Cards View”Click Cards to switch from the table to a card layout. Cards are useful when you want a more visual view of the same risk signals.
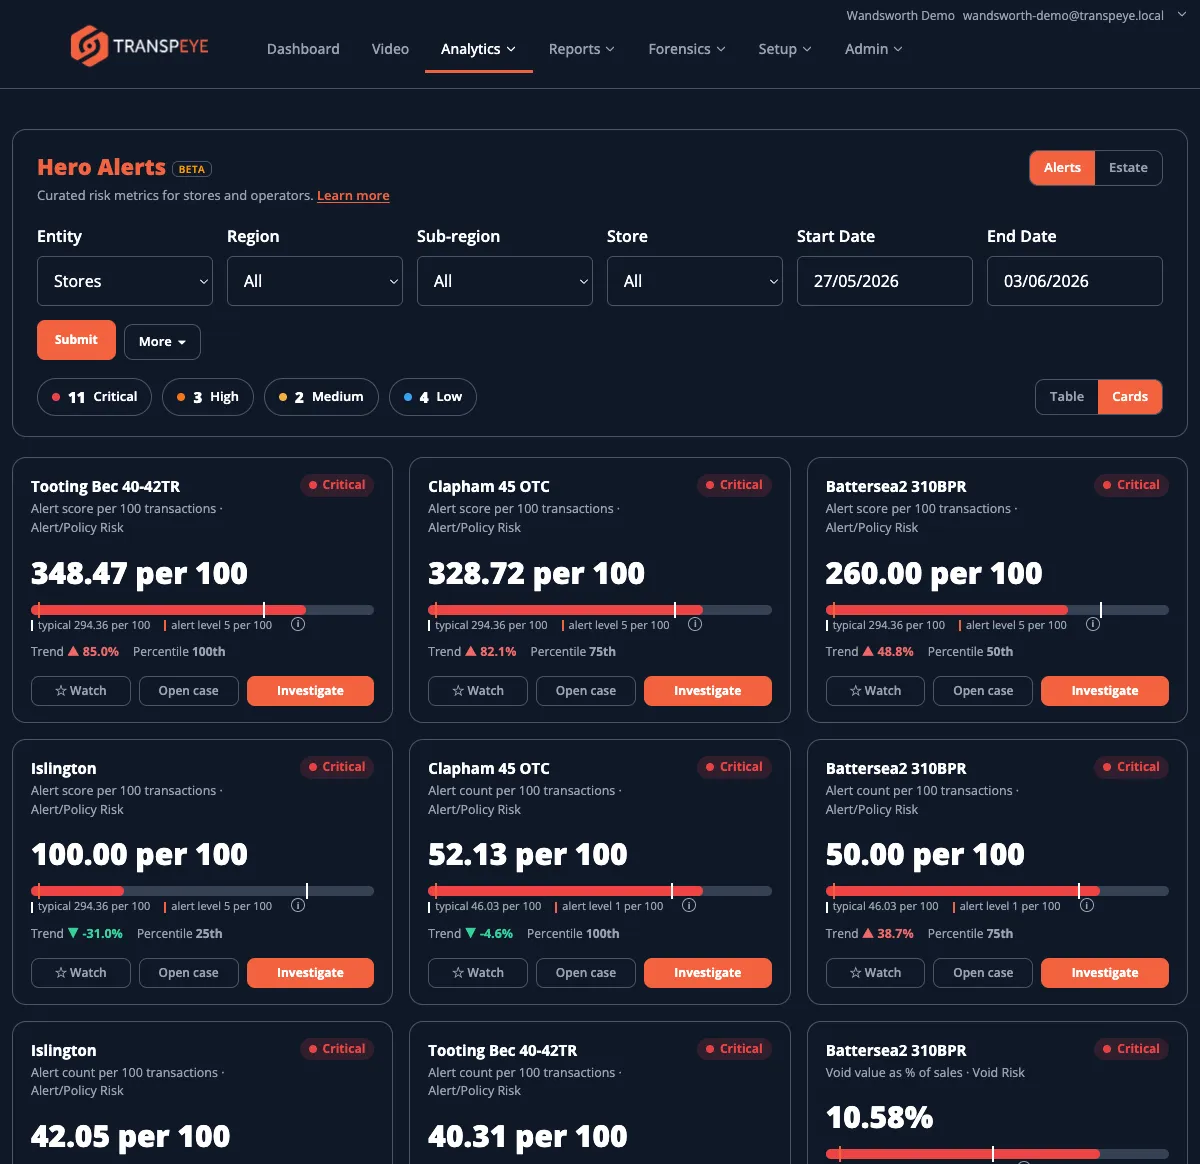
Each card shows the entity, metric, severity, current value, peer baseline, threshold marker, trend, percentile, and action buttons. Use Investigate to continue into the underlying Transpeye context for that entity or metric.
Step 5: Read the Learn More Explanation
Section titled “Step 5: Read the Learn More Explanation”Click Learn more near the Hero Alerts title to open the explanation panel.
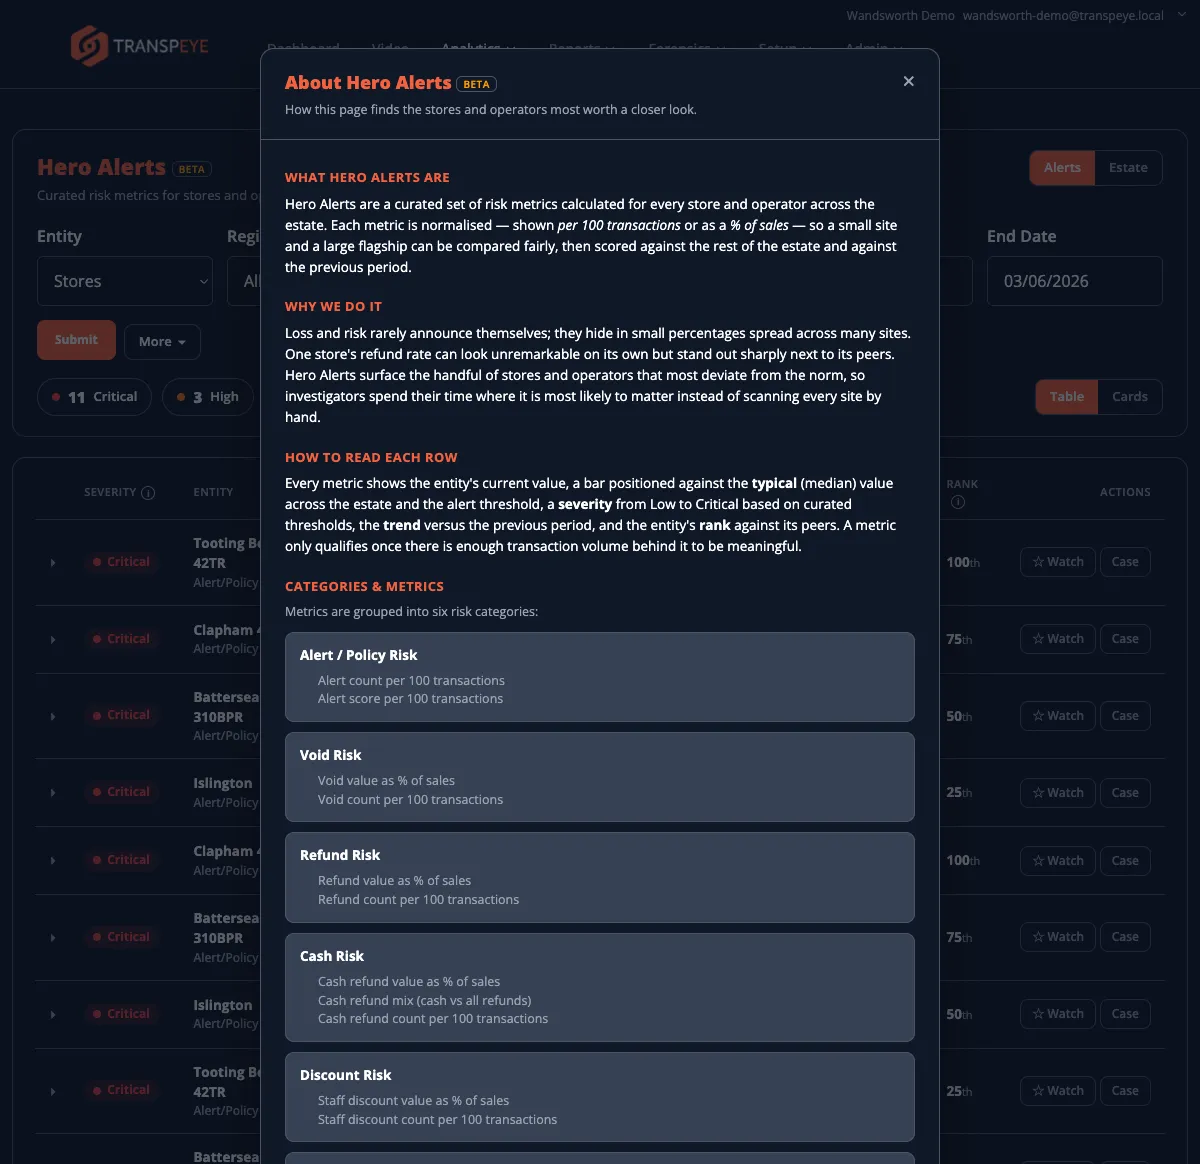
The panel explains:
- what Hero Alerts are;
- why the metric is useful;
- how to read the current value, typical value, severity, trend, and rank;
- which risk categories and metrics are included.
Use this panel when reviewing Hero Alerts with managers who are new to the scoring format.
Step 6: Switch to Estate Overview
Section titled “Step 6: Switch to Estate Overview”Click Estate to open the estate overview. This view groups stores or operators against risk categories so you can see whether risk is concentrated in one entity or spread across one type of behaviour.
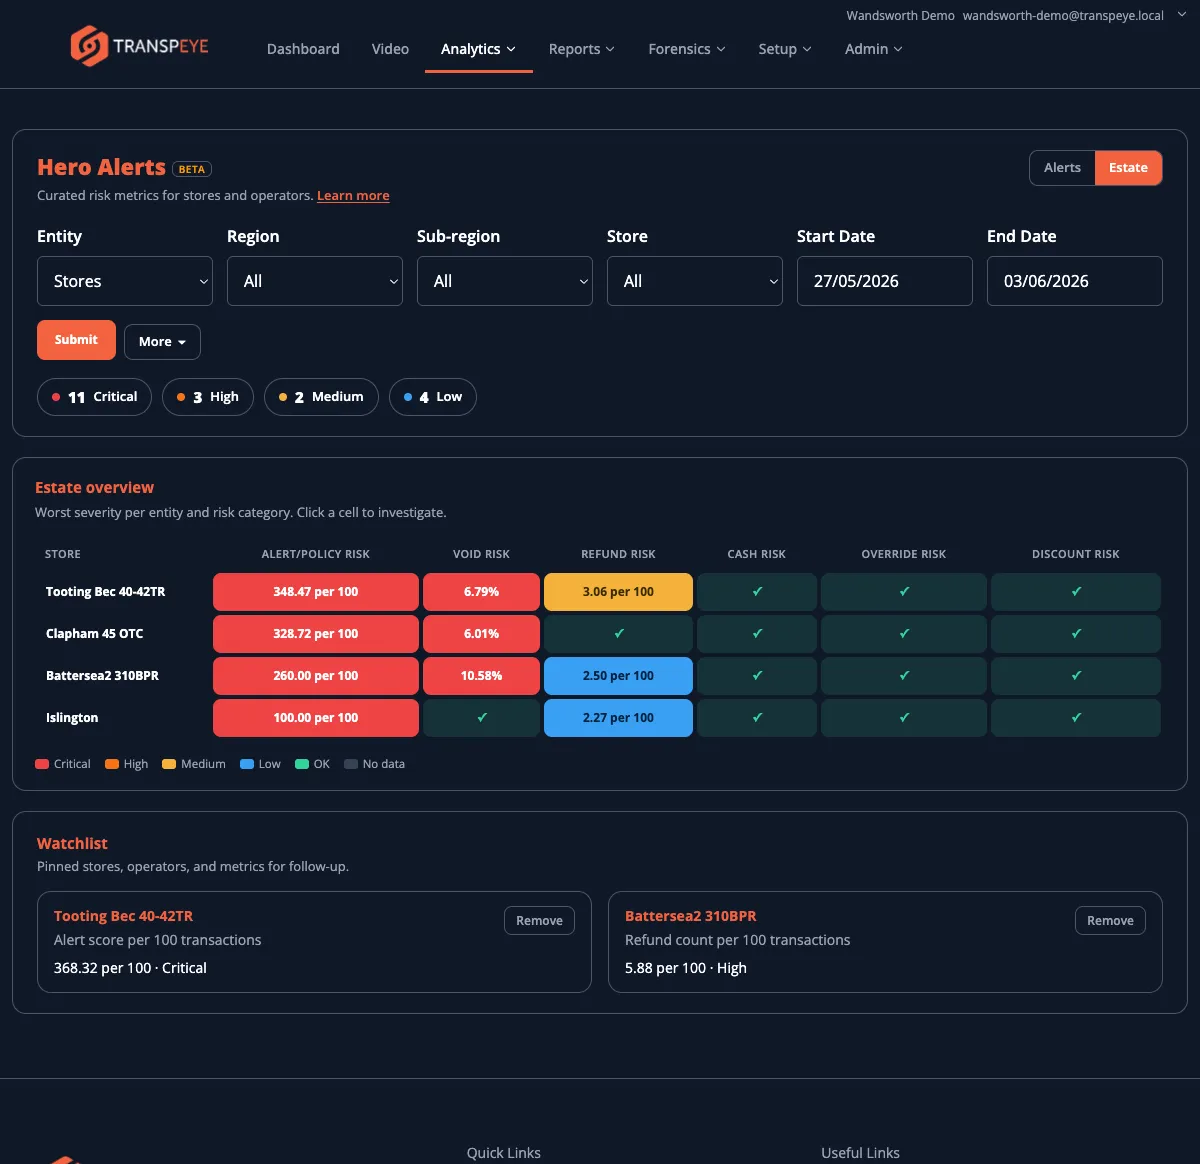
Red or orange cells indicate higher severity. Green ticks show categories that are currently OK. Click a populated cell to investigate the related metric.
Step 7: Add a Hero Alert to the Watchlist
Section titled “Step 7: Add a Hero Alert to the Watchlist”Click Watch on a row or card to pin that store, operator, and metric for follow-up. Watched items appear in the Watchlist section on the Estate view.
Use the watchlist for signals that do not need an immediate case but should be reviewed again after more data arrives.
Step 8: Open a Case from a Hero Alert
Section titled “Step 8: Open a Case from a Hero Alert”Click Case or Open case when a Hero Alert should become part of an investigation. Transpeye opens the case workflow with the Hero Alert context preserved, including the entity, metric, value, severity, peer comparison, and period details.
Use this for signals that need formal review, evidence gathering, notes, or an exportable case pack. See Case Management for the full case workflow.
Step 9: Review Store and Operator Scorecards
Section titled “Step 9: Review Store and Operator Scorecards”Store and operator detail pages can show Hero Risk Scorecards when Hero Alerts are enabled. These scorecards summarise the latest risk profile for that entity, grouping metrics by risk category and showing which values are driving the overall score.
Use scorecards when you already know the store or operator you want to review and need a compact explanation of their current risk profile.
Step 10: Generate a Hero Report
Section titled “Step 10: Generate a Hero Report”Hero Alerts can also be included in reports. On the Reports > On-demand page, choose the Hero report type where available. Hero reports summarise store and operator outliers, biggest spikes, peer outliers, and cash refund watchlist signals using the same Hero Alert calculations as the dashboard and analytics page.
- Start with severity, then trend. A Critical item that is also rising quickly should usually be reviewed before a stable low-severity item.
- Use normalised values for fair comparison. Metrics such as “per 100 transactions” or ”% of sales” make small and large stores easier to compare.
- Check the peer comparison. A high raw value may be normal for a busy store; the Vs Typical column helps you see whether it is unusual for its peer group.
- Use the watchlist for monitoring. Not every Hero Alert needs a case. Watch items that need follow-up but not immediate formal investigation.
- Use cases for formal investigations. If you need notes, linked evidence, or an exportable pack, open or create a case from the Hero Alert.
Troubleshooting
Section titled “Troubleshooting”| Problem | Solution |
|---|---|
| Hero Alerts is not visible | The feature may not be enabled for your account, or your role may not include Analytics access. Contact your administrator. |
| The page shows no Hero Alerts | The selected period, entity type, or filters may not have enough qualifying data. Widen the date range or clear filters. |
| A metric says there is insufficient data | Some metrics require enough transaction, alert, or payment volume to be meaningful. Try a longer period or review a higher-level entity. |
| The Case button is disabled or missing | Case Management may not be enabled for the customer, or your role may not include case access. |
| Hero report is not listed | The Hero report type is available only when Hero Alerts are enabled for the account. |